
Master Data Visualization with Tableau
A practical, beginner-friendly Tableau course: connect data, build charts and combine them into clear interactive dashboards ready to share.
Start Learning
Join learners who transformed their careers with MITS Edge.
Program Overview
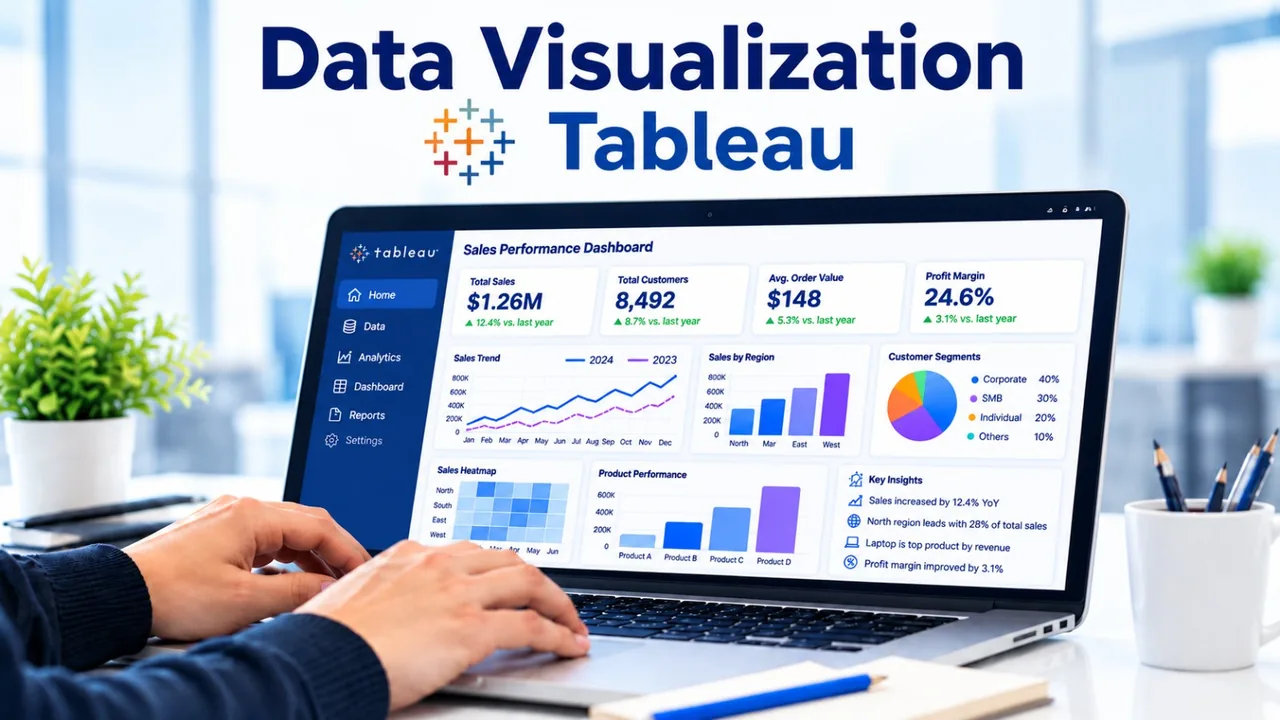
Data Visualization with Tableau is a beginner-level live online course running 6 weeks (42 hrs), priced at $500 USD, taught by instructors in evening and weekend cohorts for learners in the US and Canada, with a certificate of completion.
A practical, beginner-friendly Tableau course: connect data, build charts and combine them into clear interactive dashboards ready to share. What you will build: a sales analysis dashboard, a geographic map view and a published Tableau Public portfolio piece. Tools and technologies: Tableau Desktop, Tableau Public, Excel, CSV and database sources. Format: 42 hours of live, instructor-led online training over about 6 weeks, in evening and weekend cohorts for learners in the US and Canada, with hands-on labs, recorded sessions and mentor support. Career pathways: Data Analyst, Reporting Analyst, Junior BI Analyst, Business Analyst. Resume review and interview guidance are available to all learners.
Course Highlights
- 42 hours of live instructor-led training
- Hands-on labs and guided mini projects
- Tools: Tableau Desktop, Tableau Public, Excel
- Certificate of completion
- Career guidance for US & Canada job market
- Recorded sessions and mentor support
Minimum Requirements
- No prior experience required
- Laptop or desktop with stable internet
Who is this for ?
- Beginners starting with Tableau
- Excel users moving to visual analytics
- Students building a portfolio
Curriculum
Course Curriculum
5 modules · 15 topics0 hours total
- 1Tableau interface
- 2connecting to data
- 3dimensions and measures
Industry-Recognized
Certification
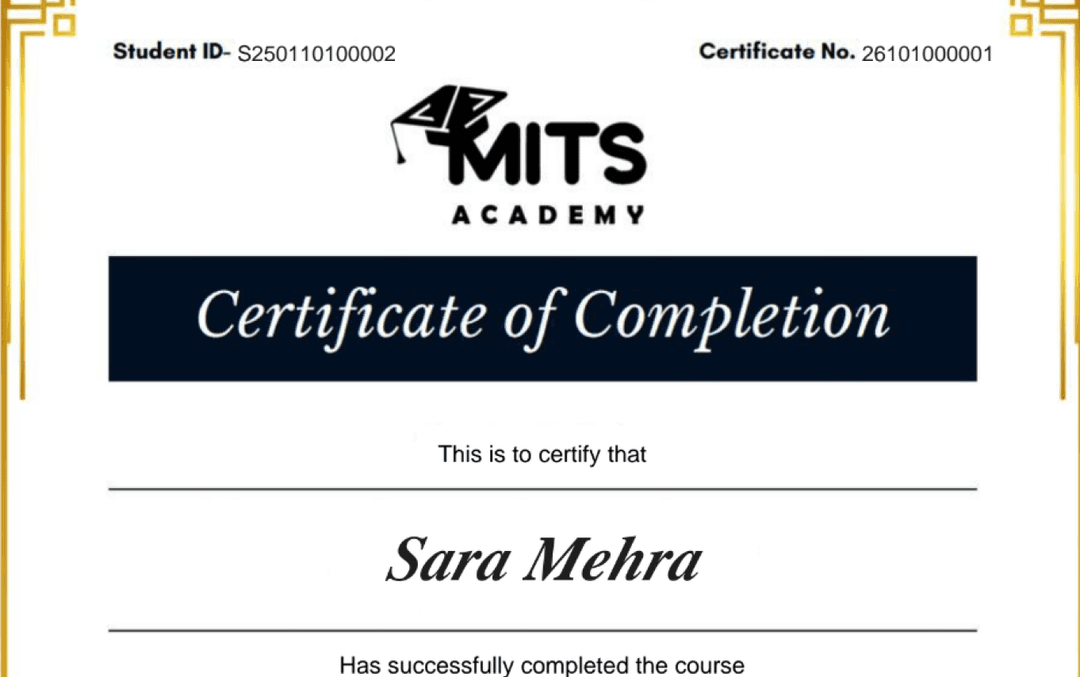
Upon successful completion, you receive a certificate of completion for the Data Visualization with Tableau program that you can share with employers and add to your LinkedIn profile — a record of the hands-on skills and projects you completed.
- Verifiable ID: Unique credential link for LinkedIn.
- Skill Validation: Proof of hands-on project completion.
- Corporate Branding: CO-branded with your company logo.
Student Reviews
Why learn this online
Business Intelligence and data warehousing sit at the center of how companies turn raw data into decisions. Learning tools like Power BI, Tableau, or a modern warehouse platform online, in a live cohort with real datasets, builds the dashboard and modeling portfolio hiring managers actually screen for — without needing a data science background.
Who this is for
- ✓Analysts wanting to specialize in dashboards and reporting
- ✓SQL-comfortable professionals moving into BI tooling
- ✓Career switchers targeting enterprise data roles
Career outcomes
- BI Developer
- BI Analyst
- Data Warehouse Engineer
- Reporting & Analytics Specialist
Frequently asked questions
How much does the Data Visualization with Tableau course cost?
The Data Visualization with Tableau course costs $500 (USD) for 6 Weeks (42 hrs) of live, instructor-led online training. The fee covers live classes, recorded sessions, hands-on projects, mentor support and the certificate of completion.
What projects will I build in Data Visualization with Tableau?
You will build a sales analysis dashboard, a geographic map view and a published Tableau Public portfolio piece.
Which tools and technologies does Data Visualization with Tableau cover?
Data Visualization with Tableau covers Tableau Desktop, Tableau Public, Excel, CSV and database sources.
Is the Data Visualization with Tableau course online or in person?
The Data Visualization with Tableau program is delivered live and online with instructor-led sessions, so you can join from anywhere in the US, Canada, or beyond. Sessions are interactive and recordings are available for review.
How long is the Data Visualization with Tableau course?
The Data Visualization with Tableau program runs for 6 Weeks (42 hrs). Cohorts are scheduled in the evenings and on weekends to fit around a full-time job.
What level is the Data Visualization with Tableau course — is it suitable for beginners?
The Data Visualization with Tableau program is pitched at a beginner level. It is designed to be accessible to newcomers, starting from fundamentals.
Do I get a certificate after completing Data Visualization with Tableau?
Yes — you receive a verifiable certificate of completion for the Data Visualization with Tableau program, which you can share with employers and add to your LinkedIn profile.
Does the Data Visualization with Tableau course include placement or career support?
Yes. MITS Edge programs include career support — resume reviews, mock interviews, and job-search guidance aligned to the US and Canadian hiring markets.
Do I need any prior experience to join Data Visualization with Tableau?
Recommended prerequisites: No prior experience required; Laptop or desktop with stable internet.
Which BI tool should I learn first — Power BI or Tableau?
Power BI has the broadest enterprise adoption, especially in Microsoft-centric companies; Tableau is strong in analytics-heavy organizations. The underlying skills — data modeling, DAX/calculations, dashboard design — transfer between the two.
Do I need to know SQL for BI roles?
Yes, SQL is foundational for BI and data warehousing work — most programs teach it alongside the BI tool itself.
Related Courses

Power BI for Business Analytics
Learn Power BI from the ground up — import and shape data, build a model, write your first DAX measures and publish interactive reports for business users.

Data Visualization – Career Program
A career-focused data visualization program that combines design principles with Tableau, Power BI and Python charting to turn complex data into dashboards that drive decisions.

Data Visualization Essentials
Learn to turn raw numbers into clear, persuasive visuals — chart selection, dashboard design and storytelling — using Excel and modern BI tools.
Data Warehousing Fundamentals
Understand how enterprise data warehouses are designed and built — architecture, ETL, dimensional design and the modern cloud warehouse landscape.